Quick and dirty analysis of memory allocations in Visual Studio code
Yesterday I was bemoaning encapsulation and how it was hiding what was going on inside my objects (and quite right too, what good would it be otherwise?). The issue is that the object I was interested in, and each of the objects that formed it, were allocating more memory that expected. It wasn’t so much that the object was bigger than expected, just that there were more allocations than I expected and that for some reason destroying lots of these objects is taking longer than I would expect.
I’m not convinced that the problem I’m seeing here is actually related to the number of allocations, but I’m exploring all options right now. The perfmon traces that I have show a non-linear shape for releasing these objects, we’re fast, then we’re slow for a long time, then we’re fast again. If it were just a case of the number of allocations being the problem then I would expect a more predictable shape to the perf graph.
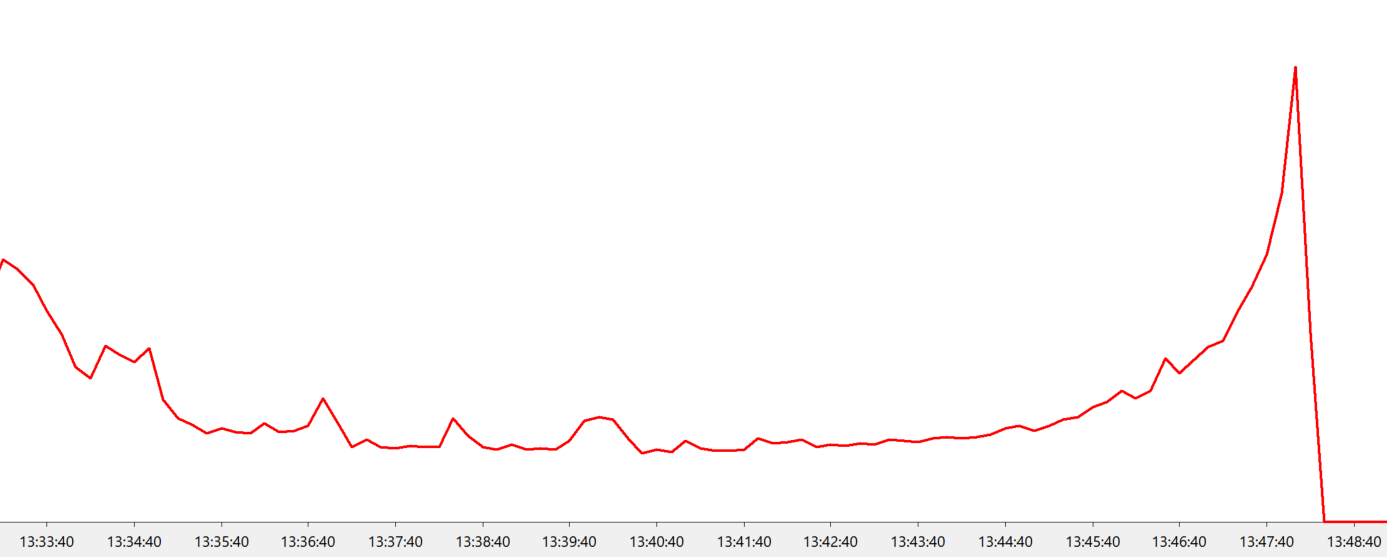
Why is the graph always this shape?
Anyway, one of the things that I wanted to do was work out where the memory was being allocated and released, and why. I decided that the quickest way to work this out was to put together a simple unit test that created the object in question and trace the memory allocator when the object was created and then again when it was destroyed.
Luckily I already had this code under test, so the code was written to be testable and getting the creation and destruction into a test harness was simple. It’s the first test that’s hard.
This code runs on Windows and Linux but this hack is limited to Windows as it uses some hooking functionality built into the debug version of the C run-time library’s memory allocation code. There are probably better ways to do this, so please use the comments to tell me.
By calling _CrtSetAllocHook()
you can add your own hook to the debug memory allocation functions. This gets called
during the memory allocation, reallocation and free operations by the debug version of
the C run-time. It’s a brute force approach you have to be a bit careful with what
you do inside the callback as you don’t want to get into a recursive call which
could end up in a stack overflow; if you’re going to allocate memory in the hook function
you need to explicitly avoid doing stuff when the hook is called recursively when
you are allocating the memory…
The code I was interested in running on one thread in a test harness which makes things easier. The test ended up looking something like this:
void Test()
{
   // (1) set up stuff we need to create the object under test...

   // (2) set up the allocation hook

   {
      ObjectUnderTest obj;

      // (3) disable allocation hook
      // (4) report on memory operations needed to create the object

      // (5) enable allocation hook
   }

   // (6) report on memory operations needed to destroy the object
}
Of course the devil is in the detail…
I used a hook that looked a bit like this.
static bool s_collect = true;

int AllocHook(int allocType, void *userData, size_t size,
              int blockType, long requestNumber,
              const unsigned char *filename, int lineNumber)
{
   (void)filename;
   (void)lineNumber;

   // We are inside the heap allocation routines, if the block type is
   // _CRT_BLOCK (2) then the CRT is allocating memory, and we should
   // probably ignore it.

   // If we want to allocate memory to track things then we need to
   // prevent the recursive call from this function also allocating
   // memory... We use the s_collect flag for this, note this is
   // a single threaded hack...

   if (s_collect)
   {
      s_collect = false;

      if (s_currentDetails < s_allocTrackerSize)
      {
         _tstring stack;

         bool wantThisOne = false;

         if (allocType != _CRT_BLOCK)
         {
            stack = s_callstackCreator.GetStack();

            wantThisOne = WantThis(stack);
         }

         if (wantThisOne)
         {
            auto &details = s_allocDetails[s_currentDetails++];

            details.allocType = allocType;
            details.userData = userData;
            details.size = size;
            details.blockType = blockType;
            details.requestNumber = requestNumber;

            if (allocType != _CRT_BLOCK)
            {
               details.stack = stack;
            }
         }
      }
      s_collect = true;
   }

   return TRUE;
}
Initially I used a fixed sized array of allocDetail structures to track
the memory operations. It was hard to get useful file and line number information
out of the hook, it required too much fiddling and was too invasive, so I
switched to grabbing a call-stack using a thin wrapper over Jochen Kalmbach’s excellent
StackWalker code. This did
lots of memory allocations for each allocation that we were tracking and
so I added a simple flag to prevent recursion. The flag starts off set but when we
start to record details of an operation we turn the flag off so that we
ignore the memory that we allocate to build the callstack, once we’ve finished
recording the real allocation we turn the flag back on. This is a bit
rubbish and only works on single-threaded code but it does the job here.
Once we have a stack trace we can look at it to see if we are interested, I’m only interested in calls that contain the object that is under test, this lets me skip any allocations that are done to allow me to create the object but that are not done by the object itself…
Once the object is constructed we can report on the allocations and end up with stuff like this:
109512: alloc - Type:1 - Size:152
minkernel\crts\ucrt\src\appcrt\heap\debug_heap.cpp (322): heap_alloc_dbg_internal
minkernel\crts\ucrt\src\appcrt\heap\debug_heap.cpp (450): heap_alloc_dbg
minkernel\crts\ucrt\src\appcrt\heap\debug_heap.cpp (496): _malloc_dbg
minkernel\crts\ucrt\src\appcrt\heap\malloc.cpp (27): malloc
D:\a\_work\1\s\src\vctools\crt\vcstartup\src\heap\new_scalar.cpp (35): operator new
S:\Stuff\src\JetByteTools\SocketTools\AddressImpl.cpp (63): JetByteTools::Socket::CAddressImpl::CreateAddress
S:\Stuff\src\JetByteTools\SocketTools\Address.cpp (63): JetByteTools::Socket::CAddress::CAddress
S:\Stuff\src\Coms\Protocol\BaseClass.cpp (318): Protocol::CBaseClass::CBaseClass
S:\Stuff\src\Coms\Protocol\ClassUnderTest.cpp (112): Protocol::CClassUnderTest::CClassUnderTest
109512: alloc - Type:1 - Size:65599
minkernel\crts\ucrt\src\appcrt\heap\debug_heap.cpp (322): heap_alloc_dbg_internal
minkernel\crts\ucrt\src\appcrt\heap\debug_heap.cpp (450): heap_alloc_dbg
minkernel\crts\ucrt\src\appcrt\heap\debug_heap.cpp (496): _malloc_dbg
minkernel\crts\ucrt\src\appcrt\heap\malloc.cpp (27): malloc
D:\a\_work\1\s\src\vctools\crt\vcstartup\src\heap\new_scalar.cpp (35): operator new
D:\a\_work\1\s\src\vctools\crt\vcstartup\src\heap\new_array.cpp (29): operator new[]
S:\Stuff\src\Coms\Protocol\OutboundDataFlow\ReliableCommandStore.cpp (194): Protocol::CReliableCommandStore::Create
S:\Stuff\src\Coms\Protocol\OutboundDataFlow\ReliableCommandCollection.cpp (124): Protocol::CReliableCommandCollection::CReliableCommandCollection
S:\Stuff\src\Coms\Protocol\BaseClass.cpp (352): Protocol::CBaseClass::CBaseClass
S:\Stuff\src\Coms\Protocol\ClassUnderTest.cpp (112): Protocol::CClassUnderTest::CClassUnderTest
109512: alloc - Type:1 - Size:1600
minkernel\crts\ucrt\src\appcrt\heap\debug_heap.cpp (322): heap_alloc_dbg_internal
minkernel\crts\ucrt\src\appcrt\heap\debug_heap.cpp (450): heap_alloc_dbg
minkernel\crts\ucrt\src\appcrt\heap\debug_heap.cpp (496): _malloc_dbg
minkernel\crts\ucrt\src\appcrt\heap\malloc.cpp (27): malloc
D:\a\_work\1\s\src\vctools\crt\vcstartup\src\heap\new_scalar.cpp (35): operator new
C:\Program Files\Microsoft Visual Studio\2022\Enterprise\VC\Tools\MSVC\14.35.32215\include\xmemory (78): std::_Default_allocate_traits::_Allocate
C:\Program Files\Microsoft Visual Studio\2022\Enterprise\VC\Tools\MSVC\14.35.32215\include\xmemory (235): std::_Allocate<16,std::_Default_allocate_traits,0>
C:\Program Files\Microsoft Visual Studio\2022\Enterprise\VC\Tools\MSVC\14.35.32215\include\xmemory (835): std::allocator<Protocol::CRTTHistory::HistoricState>::allocate
C:\Program Files\Microsoft Visual Studio\2022\Enterprise\VC\Tools\MSVC\14.35.32215\include\vector (1587): std::vector<Protocol::CRTTHistory::HistoricState,std::allocator<Protocol::CRTTHistory::HistoricState> >::_Resize_reallocate<std::_Value_init_tag>
C:\Program Files\Microsoft Visual Studio\2022\Enterprise\VC\Tools\MSVC\14.35.32215\include\vector (1634): std::vector<Protocol::CRTTHistory::HistoricState,std::allocator<Protocol::CRTTHistory::HistoricState> >::_Resize<std::_Value_init_tag>
C:\Program Files\Microsoft Visual Studio\2022\Enterprise\VC\Tools\MSVC\14.35.32215\include\vector (1656): std::vector<Protocol::CRTTHistory::HistoricState,std::allocator<Protocol::CRTTHistory::HistoricState> >::resize
S:\Stuff\src\Coms\Protocol\OutboundDataFlow\RTTHistory.cpp (37): Protocol::CRTTHistory::CRTTHistory
S:\Stuff\src\Coms\Protocol\BaseClass.cpp (368): Protocol::CBaseClass::CBaseClass
S:\Stuff\src\Coms\Protocol\ClassUnderTest.cpp (112): Protocol::CClassUnderTest::CClassUnderTest
This hacky approach works surprisingly well to give a feel for what the code is doing with the memory allocator. It allows me to ignore the encapsulation and get a view on a single aspect of the code in question; which is useful here.